United States Coast Guard Academy

15 Mohegan Avenue
GPA Requirements : Subscribe
Website Save
Carnegie Classification
Baccalaureate Colleges: Diverse Fields
Religious Affiliation
Not applicable
Federal Aid
Students cannot receive federal aid (e.g. Pell Grants).
Undergraduate students enrolled who are formally registered with office of disability services
3% or less
Special Learning Opportunities
None
Student Services
Academic/career counseling service
Credit Accepted
Institution does not accept dual, credit for life, or AP credits
  • Faculty data not available.
Estimated Expenses for Full-time Beginning Undergraduate Students
  • Beginning students are those who are entering postsecondary education for the first time.
  • No detailed yearly expense data available.
  • The United States Coast Guard Academy is a military service academy; cadets receive a stipend to cover all costs.
Alternative Tuition Plans
  • No alternative tuition plans are offered by this institution.
  • Data not available.
  • Data not available.
Net Price Calculator
An institution’s net price calculator allows current and prospective students, families, and other consumers to estimate the net price of attending that institution for a particular student.
Visit this institution's net price calculator
Fall 2021
Total enrollment (all undergraduate)1,049
Undergraduate transfer-in enrollment0
Attendance StatusStudent Gender
Attendance Status:Full-time: 100%Part-time: 0%Student Gender:Male: 60%Female: 40%
Student Race/ethnicity
Student Race/ethnicity:American Indian or Alaska Native: 0%Asian: 8%Black or African American: 4%Hispanic/Latino: 12%Native Hawaiian or other Pacific Islander: 0%White: 61%Two or more races: 11%Race/ethnicity unknown: 1%Non-resident alien: 3%
Undergraduate Student AgeUndergraduate Student Residence
Undergraduate Student Age:24 and under: 98%25 and over: 0%Age unknown: 1%Undergraduate Student Residence:In-state: 5%Out-of-state: 91%Foreign countries: 2%Unknown: 2%
  • Residence data are reported for first-time degree/certificate-seeking undergraduates, Fall 2020.
Undergraduate Distance Education Status
Undergraduate Enrollment by Distance Education Status:Enrolled only in distance education: 0%Enrolled in some distance education: 0%Not enrolled in any distance education: 100%
Undergraduate Admissions Fall 2021
TotalMaleFemale
Number of applicants2,0701,454616
Percent admitted19%16%27%
Percent admitted who enrolled69%71%68%
Admissions ConsiderationsRequiredRecommendedConsidered but not required
Secondary school GPAX
Secondary school rankX
Secondary school recordX
Completion of college-preparatory programX
RecommendationsX
Formal demonstration of competenciesX
Admission test scores (SAT/ACT)X
Other Test (Wonderlic,WISC-III,etc)X
TOEFL (Test of English as a Foreign language)X
Test Scores: Fall 2021 (enrolled first-time students)
Students submitting scoresNumberPercent
SAT21778%
ACT11341%
Test Scores25th Percentile*75th Percentile**
NOTES:
*  25% of students scored at or below
** 25% of students scored above
  • Data apply to first-time degree/certificate-seeking students.
  • Institutions are asked to report test scores only if they are required for admission.
SAT Evidence-Based Reading and Writing600690
SAT Math600700
ACT Composite2430
ACT English2432
ACT Math2530
First-to-Second Year Retention Rates

Retention rates measure the percentage of first-time students who are seeking bachelor's degrees who return to the institution to continue their studies the following fall.

Retention Rates for First-Time Students Pursuing Bachelor's Degrees
Student retention:Full-time students: 94%
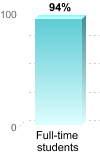
Percentage of Students Who Began Their Studies in Fall 2020 and Returned in Fall 2021
Overall Graduation Rate and Transfer-Out Rate

The overall graduation rate is also known as the "Student Right to Know" or IPEDS graduation rate. It tracks the progress of students who began their studies as full-time, first-time degree- or certificate-seeking students to see if they complete a degree or other award such as a certificate within 150% of "normal time" for completing the program in which they are enrolled.

Some institutions also report a transfer-out rate, which is the percentage of the full-time, first-time students who transferred to another institution.

Note that not all students at the institution are tracked for these rates. Students who have already attended another postsecondary institution, or who began their studies on a part-time basis, are not tracked for this rate. At this institution, 100 percent of entering students were counted as "full-time, first-time" in 2021.

Overall Graduation and Transfer-Out Rates for Students Who Began Their Studies in Fall 2015
Overall graduation rate:Overall graduation rate: 92%(*) Transfer-out rate:
Percentage of Full-time, First-Time Students Who Graduated or Transferred Out Within 150% of "Normal Time" to Completion for Their Program
  • (*) Not all institutions report transfer-out rates.
Bachelor's Degree Graduation Rates

Bachelor’s degree graduation rates measure the percentage of entering students beginning their studies full-time and are planning to get a bachelor’s degree and who complete their degree program within a specified amount of time.

Graduation Rates for Students Pursuing Bachelor's Degrees
Bachelor's degree rate:[Began in Fall 2013]4-year: 89%6-year: 89%8-year: 89%[Began in Fall 2015]4-year: 91%6-year: 92%
Percentage of Full-time, First-time Students Who Graduated in the Specified Amount of Time and Began in Fall 2013 or Fall 2015
6-Year Graduation Rate by Gender for Students Pursuing Bachelor's Degrees
6-Year Graduation Rate by Gender for Students Pursuing Bachelor's Degrees:Male: 94%Female: 89%
Percentage of Full-time, First-time Students Who Began Their Studies in Fall 2015 and Received a Degree or Award Within 150% of "Normal Time" to Completion for Their Program
6-Year Graduation Rate by Race/Ethnicity for Students Pursuing Bachelor's Degrees
6-Year Graduation Rate by Race/Ethnicity for Students Pursuing Bachelor's Degrees:Asian: 92%Black or African American: 92%Hispanic/Latino: 86%Native Hawaiian or other Pacific Islander: 100%White: 92%Two or more races: 96%Race/ethnicity unknown: 100%Non-resident alien: 100%
Percentage of Full-time, First-time Students Who Began Their Studies in Fall 2015 and Received a Degree or Award Within 150% of "Normal Time" to Completion for Their Program
Completions (Number of awards conferred) 2020-2021
Completions are the number of awards conferred by program and award level.
sort byProgramBachelor
  • Data shown are for first majors.
  • (-) Program is not offered at this award level.
Business, Management, Marketing, and Related Support Services
Business Administration and Management, General53
Category total53
Computer and Information Sciences and Support Services
Computer and Information Systems Security/Auditing/Information Assurance0
Category total0
Engineering
Civil Engineering, General20
Electrical and Electronics Engineering21
Mechanical Engineering18
Naval Architecture and Marine Engineering22
Operations Research42
Category total123
Physical Sciences
Oceanography, Chemical and Physical27
Category total27
Social Sciences
Political Science and Government, General48
Category total48
Grand total251
  • No varsity sports data reported for this institution. Data on varsity athletics are submitted annually as required by the Equity in Athletics Disclosure Act (EADA), by all co-educational postsecondary institutions that have an intercollegiate athletics program. For the most recent data collection, EADA did not collect data on varsity athletics for programs that were cancelled due to the Coronavirus Pandemic.
Institutional Accreditation
AccreditorStatusNext Review Date
New England Commission of Higher EducationAccredited since (12/01/1952)12/31/2020
  • For more detailed information on accreditation for this institution, including all actions and justification for actions, visit OPE's Database of Accredited Postsecondary Institutions and Programs: ope.ed.gov/dapip/#/institution-profile/108612.
  • No campus security data reported for this institution.